
Feature 01
One chart, every timeframe
Candles from one second to five years. Pick a range and the chart picks a sensible candle size, or set the interval yourself. Candles, bars, Heikin-Ashi, line or area.
↳ 1D to All on one chart
A free stock terminal for the US market
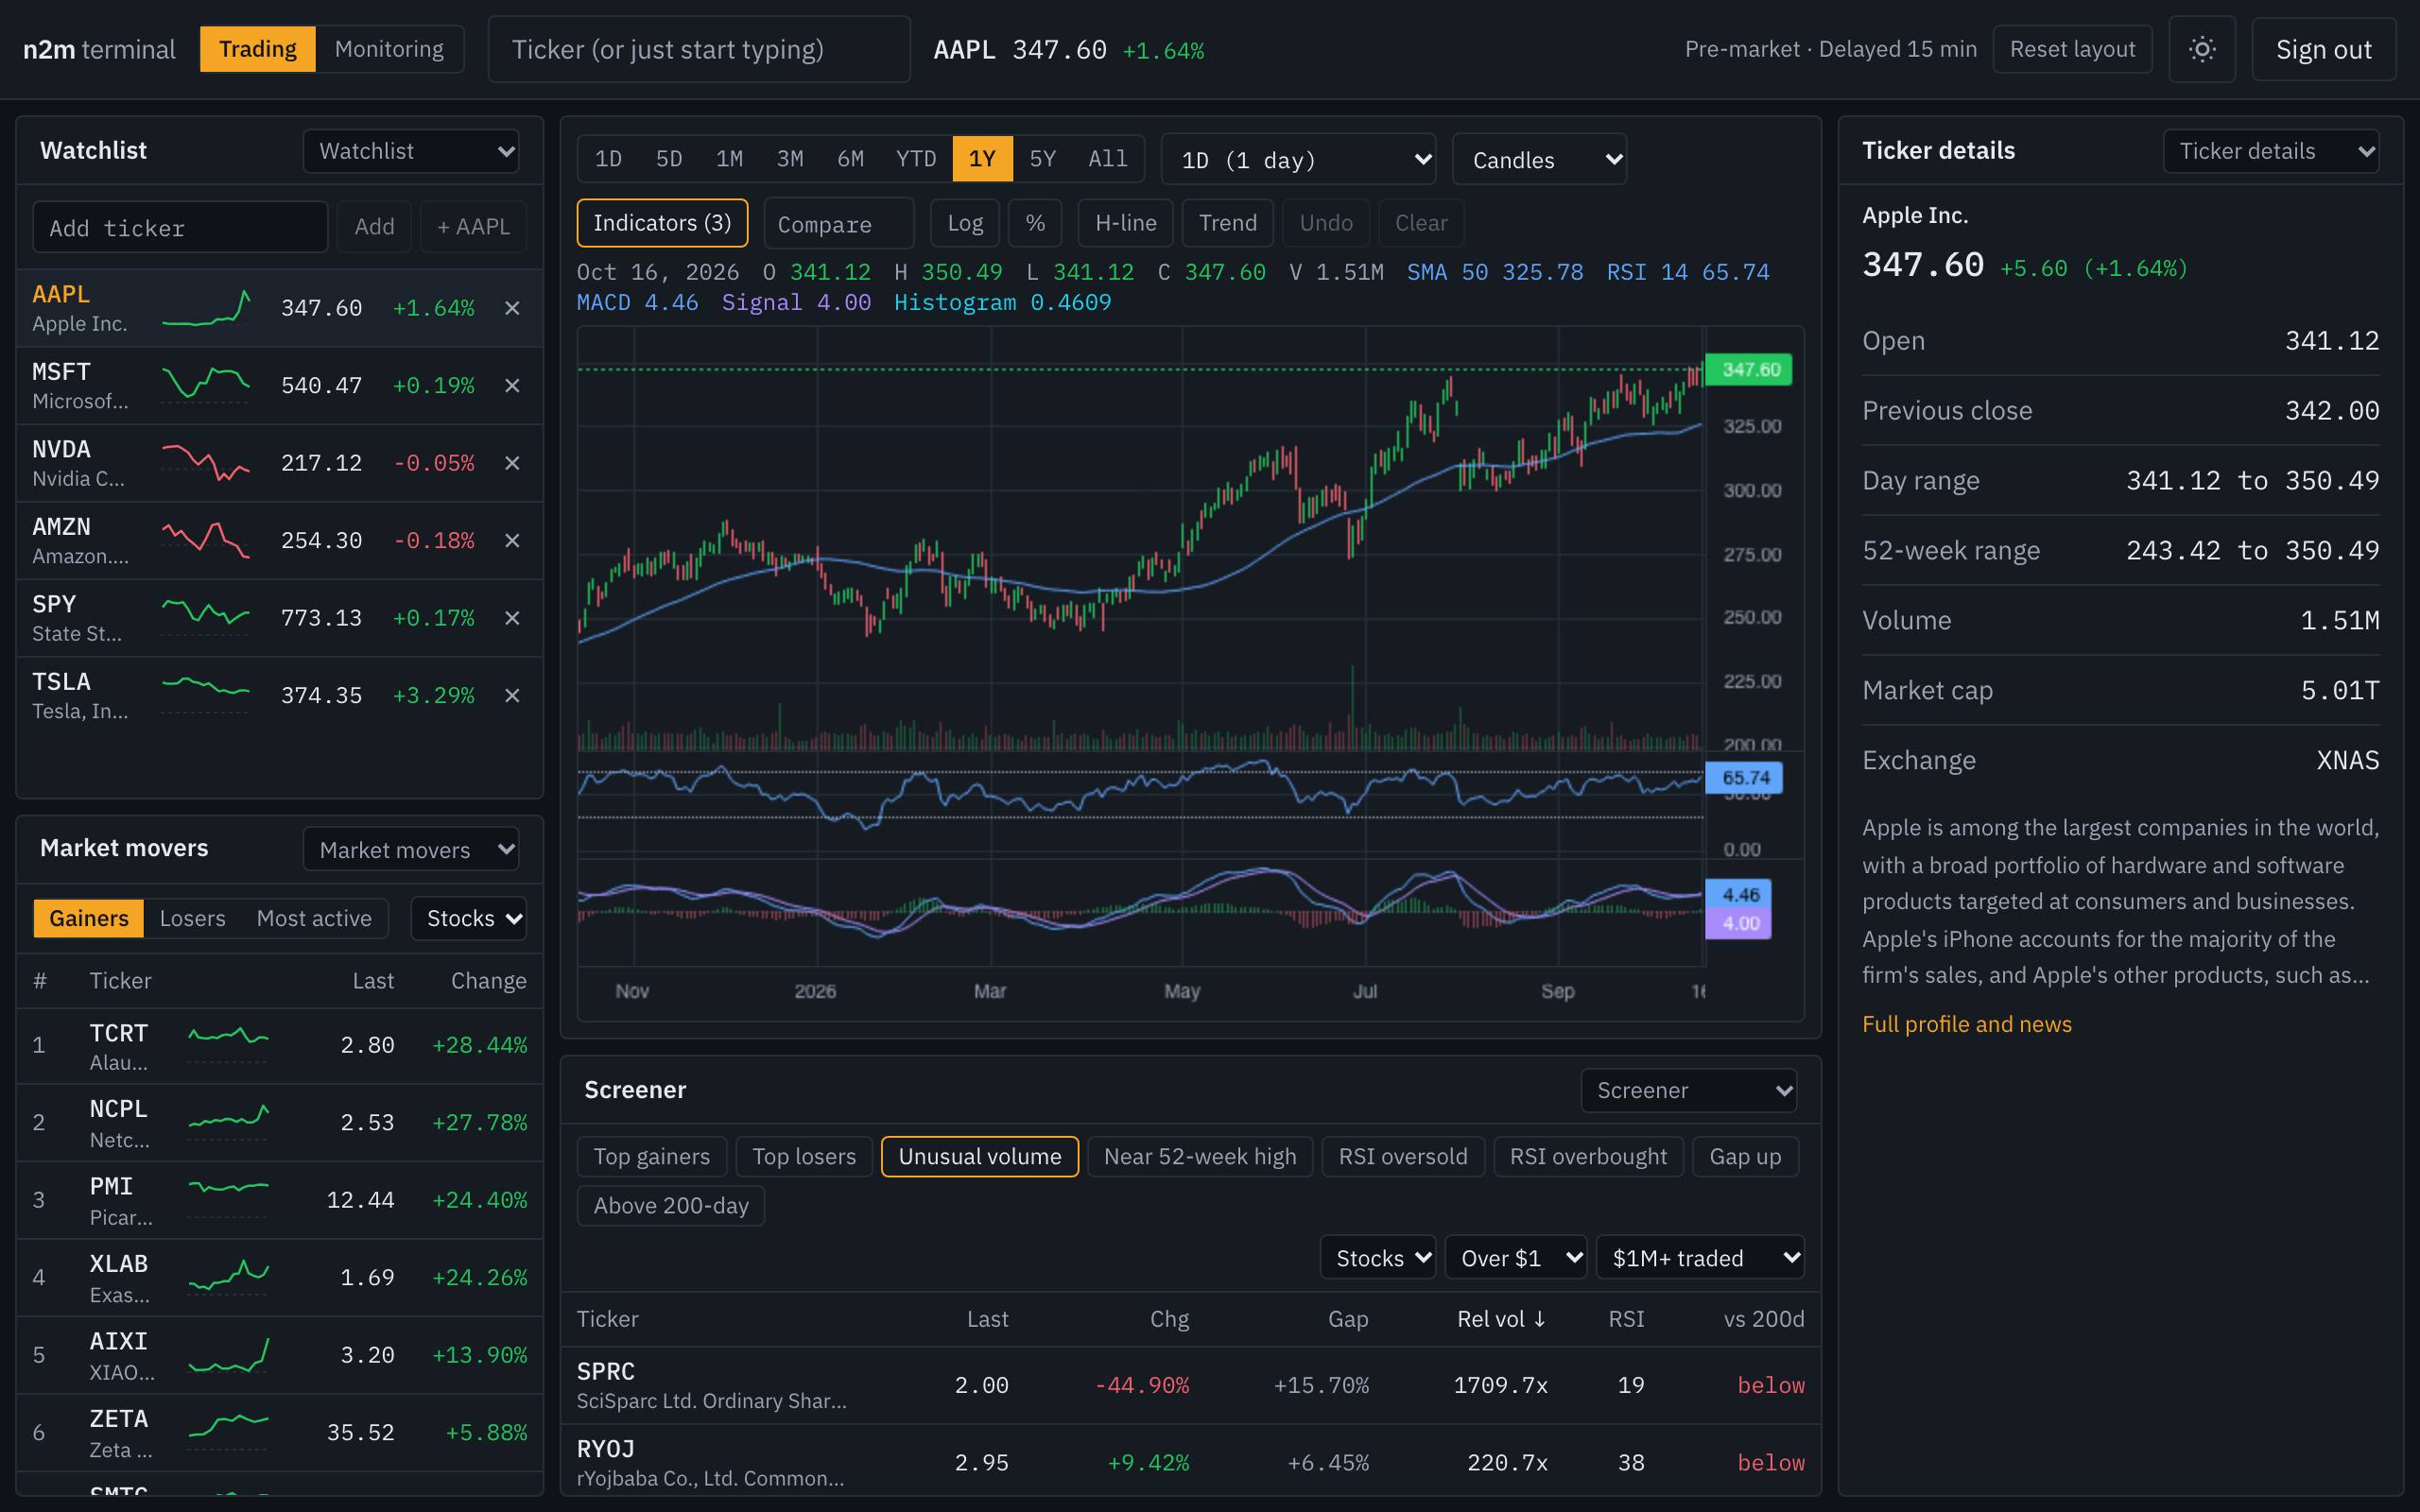
Charts from one second to five years, 10 technical indicators, a screener over every stock that traded and a watchlist that updates on its own.
Why n2m
The same tools on the stock pages and in the terminal, from the same feed.
See today's moversCandles from one second to five years. Pick a range and the chart picks a sensible candle size, or set the interval yourself. Candles, bars, Heikin-Ashi, line or area.
↳ 1D to All on one chart
Moving averages, Bollinger Bands, VWAP, RSI, MACD, Stochastic and more, each with its own length. Values follow your cursor across the chart.
↳ 10 indicators, up to 8 per chart
Each evening it recomputes change, gap, relative volume, RSI and the 20, 50 and 200-day averages for every stock that traded. Start from a preset, sort by any column.
↳ Recomputed after every close
The monitoring view splits the screen into one, two or four charts, each with its own interval and indicators. Link them and they follow the same ticker.
↳ 1, 2 or 4 linked charts
10
Technical indicators
Stack up to 8
9
Chart ranges
1D to all history
1s
Smallest candle
Streams live
4
Linked charts
Monitoring view
$0
Price
No card, no trial
Live market prices
The last session's biggest movers, from the same feed as the terminal. Open any of them without an account.
| # | Stock | Price | Change | Volume | Today | Open |
|---|---|---|---|---|---|---|
Built for every screen
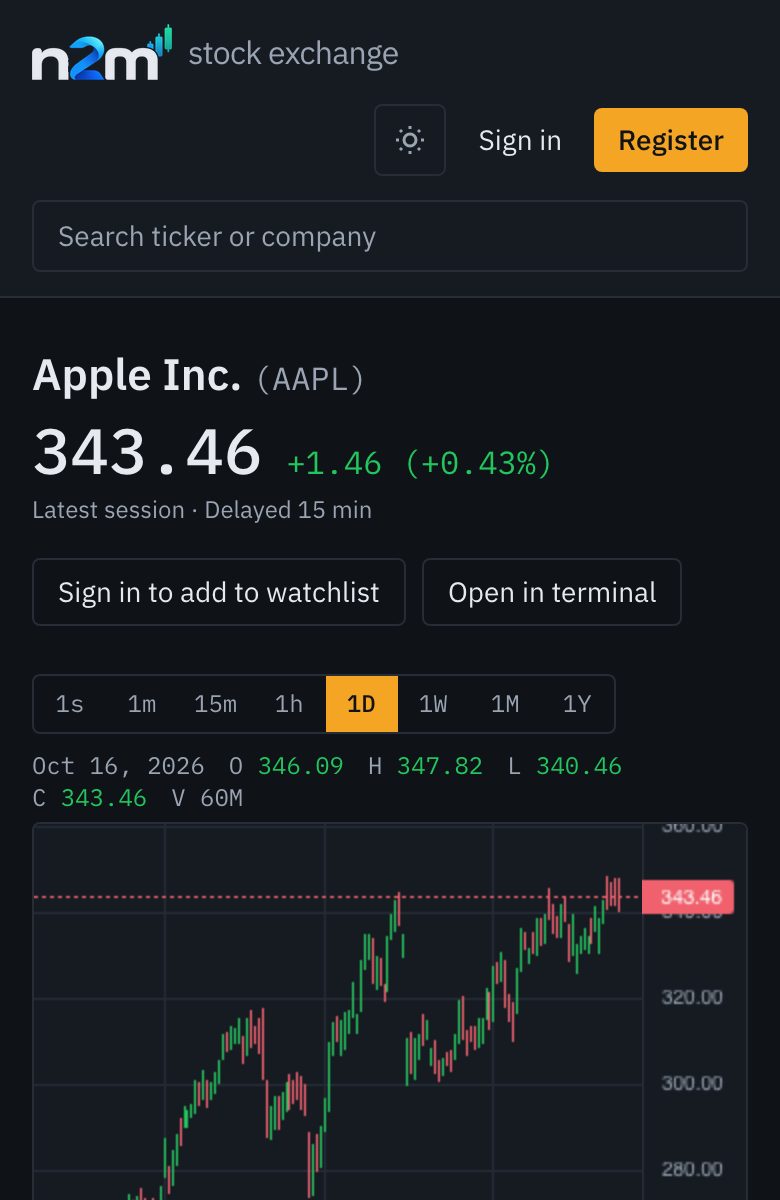
One account, in any browser. Your watchlist follows you from desktop to phone.
Before you sign up
No. n2m is a research tool, not a broker: you cannot place orders, and nothing on the site is investment advice.
Nothing. An account only stores your watchlist, terminal layout and chart drawings.
US stocks and ETFs. There are no options, futures, crypto or index levels.
No. Every stock page, with its chart, facts and news, is open without signing in. The terminal needs an account so it can remember your layout.
Free, with nothing to install. Make an account and the terminal opens with your watchlist ready to fill.
By creating an account you agree to the Terms of Service and Privacy Policy.